A Poverty of Thinking about Poverty Measures in New Jersey School Finance
Link to PDF of Policy Brief: Poverty_Counts_July_2013
Bruce D. Baker, Rutgers University, Graduate School of Education
Introduction
Every few years or so, in nearly any state but especially in those where leadership is actively seeking ways to reduced financial support to local public school districts serving lower income children,[1] one can expect the re-emergence of politically induced media outrage over rampant fraud in National School Lunch Program. The usual course of events is as follows:
- Manufacture some scandalous but largely anecdotal manifesto about how local district officials are egregiously mislabeling children as low income in order to hoard and obscene sums of state aid.
- Manufacture other claims that poverty really doesn’t matter anyway and certainly these poverty measures have little or nothing to do with determining whether children are likely to do well in school.[2]
- Assign a task force composed mainly of lay people with little or no expertise in education policy, finance or specifically the measurement of poverty, to swallow whole the manufactured evidence and generate politically convenient policy recommendations.
During my years in Kansas, on faculty at the University of Kansas, similar debates occurred with regularity. At one point, the legislature established an “At Risk Council” whose charge was to evaluate alternative proxies for determining student need, to be used in the state aid formula. Former education Commissioner Andy Tompkins was assigned to chair the task force, which eventually concluded:
The Council continues to believe that the best state proxy for identifying at-risk students is poverty, whether that be measured by free or free and reduced price lunches.[3]
Nonetheless, Kansas legislators continued to seek, and eventually adopt, alternative measures that would drive additional funding to lower poverty suburban districts, and thus, away from higher poverty districts, under the auspices of special needs.[4]
In 2011, the New Jersey State Auditor released a report blasting rampant fraud in the school lunch program.[5] In 2012, a task force primarily of lay persons was formed to evaluate whether the state aid formula should continue to drive funding to local public school districts on the basis of these obviously fraudulent and overstated counts of children in need. But little seems to have come thus far of last year’s efforts to raise suspicion over the implications of supposed rampant fraud in the free and reduced lunch program for the equity and adequacy of the state aid formula.
Thus, here we go again. This month, the New Jersey auditor has released yet another scathing report of rampant fraud, instigated by local school officials, in the National School Lunch Program. Immediately that report has been cast as having significant implications for how school funding is allocated.[6]
This year’s report again audited a select number of applications for the school lunch program, from 15 school districts, finding cases of misreported income, often by school officials themselves. Such fraud, if indeed validly characterized in the auditor’s report, is certainly wrong and should be handled appropriately. But the implications of the auditor’s findings for using subsidized lunch as a measure for driving state aid are negligible, other than the fact that the state should continue regular auditing.
Income Measures & School Funding Formulas
The basic assumption behind targeting additional resources to higher poverty schools and districts is that high need districts can leverage the additional resources to implement strategies that help to improve various outcomes for children at risk. Some share of the additional resources is needed in higher poverty settings simply to provide for “real resource” equity – or to pay the wage premium required to recruit and retain teachers into higher poverty settings. Further, resource intensive strategies such as reduced class sizes in the early grades, intensive tutoring and extended learning time programs may significantly improve outcomes of low income students.
When seeking a measure for differentiating between higher and lower need settings, the idea is to find that indicator or measure that seems to best capture the likelihood that children will struggle in school – that they will enter kindergarten less prepared and have access to fewer out of school resources during their time in school (including limited summer learning opportunities).
A variety of socioeconomic indicators might be considered. But often, the information that happens to be most available is counts of kids who are from low income families, as identified through the National School Lunch Program income criteria. And, as a measure of convenience, it tends to work quite well. I compare this measure below with Census poverty measures, based on children in families living in a certain area (within school district boundaries) who fall below the much lower income threshold of 100%, which has some advantages but also some major shortcomings.
To determine whether school lunch counts are useful for guiding school finance policies, one must look more broadly at the validity of these measures when cast at the school district level, statewide. Small scale audits of individual applications are of marginal use in this regard. The simplest validity checks on the usefulness of subsidized lunch measures as a student need proxy for state aid are as follows:
Is the Poverty Measure Correlated with Other Poverty Measures?
It is indeed desirable to find some measure on which to base funding allocations that can’t be gamed, or manipulated by those who stand to receive the additional funding. But that’s not always feasible (or cost effective). And, even if a count method does involve local district officials gathering data, it can, and should still be audited.[7]
One reasonable way to evaluate district collected data on children qualifying for free or reduced lunch is to evaluate the relationship between the free/reduced lunch concentrations and census poverty estimates based on resident populations.
In Figure 1 we see that Census poverty rates tend to range from 0 to about 45% and free/reduced rates – children in families under a much higher income threshold, up to about 100%. In fact, as I’ve noticed in many analyses, the free/reduced lunch data tend to get messy above 80%, suggesting that this is the range within which local administrators may be maxing out their ability to get parents to comply & file paperwork. Here, we see that even though poverty rates keep climbing, free/reduced rates seem to level off. Arguably, if anything is going on here, it’s that very high poverty districts like Camden and Trenton – which fall “below the curve” are under-reporting their free/reduced rates – with some possibility of marginal over-reporting in Elizabeth.
Overall, however, census poverty explains nearly 90% of the variation in free/reduced rates.
In other words, free/reduced lunch makes a pretty good proxy.
Figure 1. Relationship between Census Poverty 2010 and District Free/Reduced Lunch 2011

In Figure 2, I’ve tried to better tease out the districts that may be under or over reporting by cleaning up the non-linear relationship by expressing both measures in their natural logarithm form. Here, we see that the relationship remains very strong and still slightly curved.
If there were districts substantially over-reporting free/reduced lunch, they would appear to pop above the outer/upper edge of the curve. That is, their reported rates would be higher than predicted based on the alternative measure. On the other hand, there are a number of districts that are relatively low in poverty but report disproportionately low free/reduced lunch rates – that is, under-reporting.
Figure 2. Logged Relationship (natural log) between Census Poverty and Free/Reduced Lunch
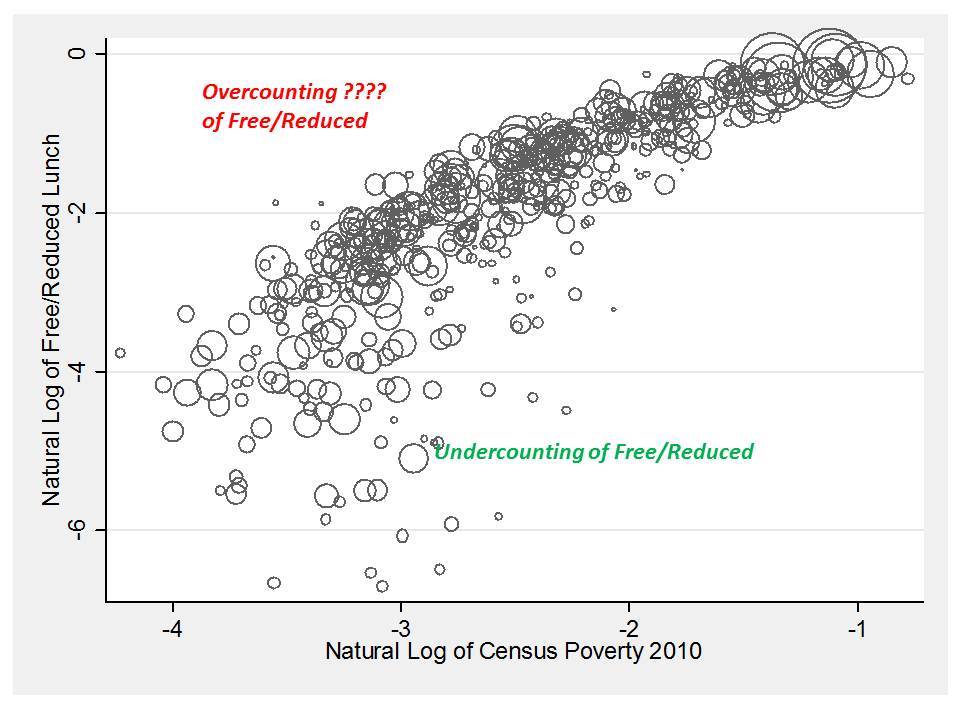
In general, these figures show that free/reduced lunch rates are a reasonable proxy for district poverty rates. These figures do not indicate substantial, systematic (beyond predicted, based on resident child poverty rates) mis-classification.
Is the Poverty Measure Correlated with Student Outcomes?
The “big question” is which version of the measure better captures differences in student outcomes – or predicts more accurately educational disadvantage. This is straightforward enough to check as well. The first figure here shows the relationship between free/reduced lunch rates and proficiency rates on state assessments in 2011.
Figure 3 shows that % free/reduced lunch alone explains about 81% of the variation in proficiency rates across districts. So, it’s a pretty reasonable proxy of educational disadvantage.
Figure 3. Free/Reduced Lunch & Proficiency in 2011
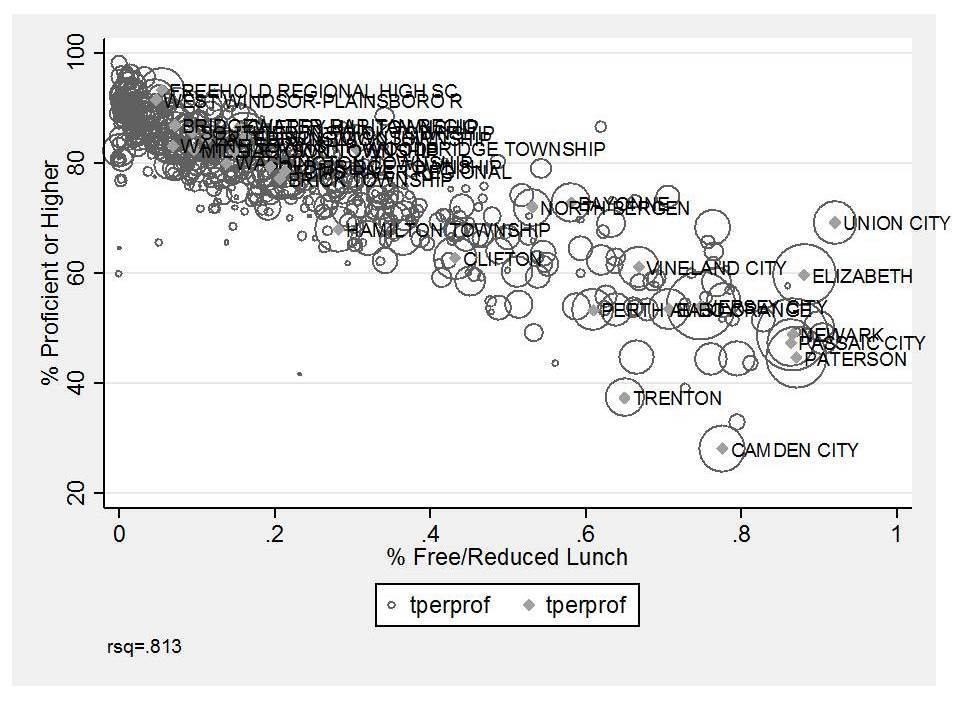
I have some concerns about the extent to which this relationship erodes at and approaching free/reduced rates above 80%. Is it really that Camden and Trenton perform that poorly compared to Union and Elizabeth despite serving even less poor populations? Or might the story be more complex than this.
Figure 4 which shows the relationship between Census Poverty and proficiency sheds some additional light on this issue.
Figure 4. Census Poverty and Proficiency

Figure 4 suggests that Camden and Trenton are actually a) higher poverty than Elizabeth (and Camden higher than Union) and b) perform more or less where they are expected to [somewhat below, as opposed to well below]. This is an interesting contrast that adds some support to my speculation above that these very high poverty cities may in fact be understating their poverty rates in their free/reduced lunch data. Indeed, there may be some overstating in Union and Elizabeth, but neither popped substantially above the curve in the previous charts.
Census poverty rates, while capturing a unique story of difference between Camden and Trenton vs. Union and Elizabeth do slightly less well at explaining variations in proficiency rates, making the free/reduced count preferable in this regard.
Additional Policy Considerations
Given all of this, there are a few additional considerations when pondering which measure to actually use in state school finance policy.
More Stringent Count Methods require Larger Weights
First, if we choose to use a more stringent income threshold for poverty, like the census poverty measure, we would need to assign the appropriate weight to drive the appropriate amount of funding to high need districts. Simply changing our method of counting kids in poverty doesn’t change the needs of Camden or Trenton. It merely recasts those needs with an alternative measure. More stringent measures require larger weights, an issue that has been explored empirically.[8]
This applies to the choice of using free lunch (130% income threshold) as opposed to free or reduced lunch. Using free lunch only might permit better differentiation between high poverty districts, but a higher weight would then be required to drive sufficient funds to those districts. That is, shifting to this weight should not drive less total targeted aid, but rather, should target that aid more accurately.
Problems with Residential/Geography Based Measures in New Jersey
Census poverty measures are limited in their usefulness in the current New Jersey policy context, because they are based on location of residence and linked to geographic boundaries of school districts. New Jersey has significant numbers of non-unified, regional secondary school districts for which poverty estimates may be imprecise or inaccurate.
Further expansion of charter schools and inter-district choice programs complicates use of measures based on place of residence. Funding to schools must be sensitive to the demographics of students enrolled in those schools. It would be entirely inappropriate, for example, to require a sending district like Newark or Camden to pay charter or other district tuition on the basis of their own average resident poverty rate if the charter school or receiving district is not taking a comparable share of children in poverty.
As a result, free or free and reduced price lunch measures likely remain preferable.
[1] The assertion here that New Jersey officials are actively seeking a rationale for reducing state aid to higher poverty districts is justified here, http://schoolfinance101.wordpress.com/2012/03/02/amazing-graph-proves-poverty-doesnt-matter/, where State Education Commissioner Cerf presents data to assert that poverty may not have strong influence on student outcomes, here (http://schoolfinance101.wordpress.com/2012/12/18/twisted-truths-dubious-policies-comments-on-the-njdoecerf-school-funding-report/) where the Commissioner asserts that “dollarizing” student needs simply doesn’t work, and most notably, here (http://schoolfinance101.wordpress.com/2013/03/02/civics-101-school-finance-formulas-the-limits-of-executive-authority/) in which I explain how state leaders have already, against authority of the school funding statute itself, chosen to calculate district aid on the basis of “average daily attendance” rather than fall enrollment count, leading to substantive, disproportionate reduction of aid to higher poverty districts.
[4] http://skyways.lib.ks.us/ksleg/KLRD/Publications/2013Briefs/2013/I-1-SchoolFinance.pdf (specifically adding a weight for non-low-income, non-proficient students)
[5] 2011 NJ State Auditor’s Report: http://www.njleg.state.nj.us/legislativepub/Auditor/10000_2011.pdf
[6] http://www.nj.com/news/index.ssf/2013/07/gov_calls_for_firings_and_prosecution_in_wake_of_cheating_scandal_in_school_lunch_program.html#incart_river_default
[7] Preferably in a more thorough and responsible way than checking a smattering of individual families’ forms for those who fall closest to the income threshold, necessarily ignoring those who fall just the other side of the threshold but didn’t file.
[8] Duncombe, W., & Yinger, J. (2005). How much more does a disadvantaged student cost?. Economics of Education Review, 24(5), 513-532.