Buyer Beware: One Newark and the Market For Lemons
Mark Weber, PhD student, Rutgers University, Graduate School of Education
PDF of Policy Brief: Weber_OneNewarkLemonsFINAL
The cost of dishonesty, therefore, lies not only in the amount by which the purchaser is cheated; the cost also must include the loss incurred from driving legitimate business out of existence.
– George A. Akerlof, The Market for “Lemons”: Quality Uncertainty and the Market Mechanism.
In his classic economics paper, Akerlof[1] addresses the problem of “asymmetrical information” in market systems. Using the used car market as an example, Akerlof shows that consumers who do not have good information about the quality of goods often get caught buying “lemons.” This not only hurts the individual consumer; it damages the market as a whole, as honest consumers and producers refuse to participate, concerned that false information keeps consumers from distinguishing a good car from a “lemon.”
The “school choice” movement is predicated on the idea that treating students and their families as “consumers” of education will introduce market forces into America’s school systems and improve the quality of education for all.[2]
But what if those families must make their choices armed only with incomplete or faulty data? How can a market operate successfully when consumers suffer from an asymmetry of information?
This brief looks at one example of asymmetrical information in a school choice system: Newark, NJ, whose schools were recently restructured under a plan entitled One Newark.
Newark’s schools have been under state control for nearly two decades; the elected school board only serves in an advisory capacity, making rapid, large-scale transformations much easier to facilitate. Under State Superintendent Cami Anderson, the district introduced One Newark, a plan that calls for students and their families to select a list of eight schools in order of preference for enrollment in the fall of 2014.
This author, in collaboration with Dr. Bruce D. Baker of Rutgers University and Dr. Joseph Oluwole of Montclair State University, has published several briefs analyzing One Newark’s consequences.[3] Among our findings:
- The plan affects a disproportionate number of black and low-income students, whose schools are more likely to close, to be turned over to charter management organizations (CMOs), or to be “renewed.”
- CMOs in Newark have little experience in educating demographically equivalent populations of students to the NPS schools; consequently, there is little evidence they will perform any better.
- The statistical practices and models NPS has used to justify the classification of schools are fundamentally flawed.
This last point is of particular concern. The One Newark application[4] gives one of three ratings for each school a family may choose: “Great,” “On The Move,” or “Falling Behind.” While the district does offer its own profiles of each school, and the NJ Department of Education does offer individual school profiles, it is likely that the ratings on the application will have the most influence on families’ decisions.
If, however, these ratings suffer from the same defects we found in NPS’s previous attempts to classify schools – the lack of accounting for student characteristics, poor statistical practice, and using flawed or incomplete measures, among other problems – families may have a disadvantage when attempting to make an informed choice.
To ascertain whether the One Newark application ratings make sense, I used a statistical modeling technique embraced by NPS itself: linear regression. Only schools reporting Grade 8 test scores were included. The model here uses four covariates the district acknowledges affect test score outcomes: free lunch eligibility, Limited English Proficiency (LEP) status, special education status, and race.[5] The percentage of each student subpopulation for each school is included in this model, along with a covariate for gender, which has been shown to have an effect on test-based outcomes. This model is quite robust: over three-quarters of the difference in test-based outcomes can be statistically explained by these five student population characteristics.
The outcome used here is the one preferred by NPS: scale scores on the English Language Arts (ELA) section of the NJASK, New Jersey’s yearly statewide test. NPS averages this score across grade levels; however, as we have shown in our previous reports on One Newark, this is poor practice, as scale score means and distributions vary by grade.[6] I explore this problem more fully in the Appendix; for now, however, I accede to NPS and use their preferred measure, however flawed it may be.
When all five covariates are included in this model, they create a prediction of how a school will perform (relative to the other schools in Newark). We can then compare the predicted performance of the school with its actual performance. While not all of the difference can or should be attributed to the effectiveness of the school, this technique does allow us to compare the school’s performance against prediction to how the district rated the school in the One Newark application.
Figure 1

Figure 1 shows the difference from prediction for Newark schools – both NPS and charters – and their rating under One Newark. Schools that are being closed or turned over to CMOs are included for comparison. This graph illustrates several important points:
- While there are many schools labeled as “Falling Behind” that perform below prediction, there are several schools that perform above prediction. Miller St. and South 17th, in particular, perform especially well given their student population. Under what criteria does NPS find that these schools are “Falling Behind”?
- Conversely, several schools that perform below prediction are rated as “On The Move” or “Great.”
- Only one charter school in the One Newark application is rated “Falling Behind” (University Heights, which did not report Grade 8 scores and is, therefore, not included in this analysis). But two charters in the application perform below prediction (Greater Newark and Great Oaks), and all except North Star[7] perform below Miller and South 17th.
- Two other charters that perform below prediction – Robert Treat and Maria Varisco-Rogers – are not included in the One Newark application; these schools opted not to participate in the universal enrollment process.
Certainly, no school should be judged solely on one (flawed) metric. The point here, however, is that even by NPS’s own questionable standards, the classification of schools under the One Newark rating system appears to be arbitrary and capricious.
To be fair, the One Newark application does state that the district did not use averaged scale scores as its sole measure of a school’s effectiveness (to my knowledge, however, NPS has never publicly released a white paper or other document that outlines its precise methodology for rating schools). The district has also used median Student Growth Percentiles (mSGPs) to create its ratings.
SGPs, as measures of growth, are ostensibly measures that do not penalize schools for having students who start at lower absolute levels but still demonstrate progress. Supposedly, SGPs account for the differences in student population characteristics, which are correlated to test results. Former Education Commissioner Christopher Cerf[8] has stated: “You are looking at the progress students make and that fully takes into account socio-economic status… By focusing on the starting point, it equalizes for things like special education and poverty and so on.”
If this were true, we would expect to see little correlation between a school’s average scale score – its “starting point” – and its mSGP. Figure 2 plots these two measures in one graph.
Figure 2

As this scatterplot shows, there is a moderate but significant correlation between a school’s growth and its “starting point.” The bias shown in a school’s scale score, created by its student characteristics, is then at least partially shown also in its mSGP. In other words: SGPs are influenced by student characteristics, but NPS does not account for that bias when using SGPs to create its ratings.[9]
If a school’s student population, then, affects its mSGP, how do student characteristics affect the One Newark ratings? Figure 3 shows the differences in student populations for all three classifications.
Schools that are “Falling Behind” have significantly larger proportions of black students than schools that are “On The Move” or “Great.” Those “Great” schools also have significantly fewer students in poverty (as measured by free lunch eligibility) than “Falling Behind” and “On The Move” schools. “Great” schools also serve fewer special education students, and a slightly smaller proportion of boys.
Figure 3
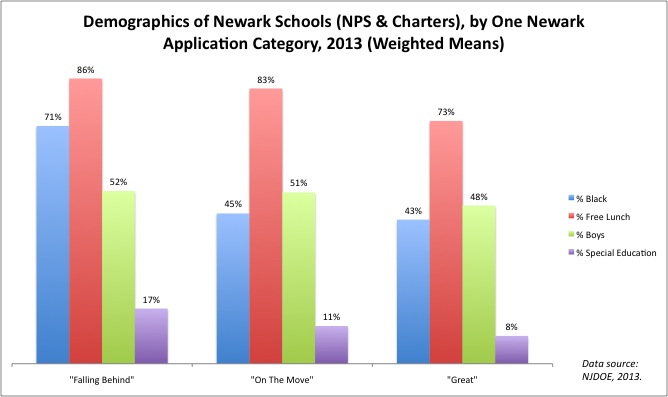
Arguably, the One Newark rating is less a measure of a school’s effectiveness than it is a measure of its student population. If a family chooses “Great” schools, they are really choosing schools with fewer black, poor, and special needs students.
There is a serious debate to be had as to whether a “choice” system of education is viable for a city like Newark. If, however, NPS has committed to One Newark, it should view its role as a “consumer advocate,” correcting the asymmetry in information and providing justifiable school ratings, rather than limiting the choices students and their families have.
Unfortunately, it appears that NPS is choosing not to be an impartial arbiter; by forcing the closure of NPS schools that, by at least some measures, outperform charters, the district is actively distorting the market forces it claims will improve education.
Under Akerlof’s theory, then, One Newark may not only lead to more student stuck with lemons: it may actually drive more non-lemons out of the market.
Technical Appendix: Problems With Averaging Scale Scores
One-Newark-Enrolls-Paper-Application
In its response to our first report on One Newark, NPS made the case that averaging scale scores across grade levels is a superior methodology to ours, which used Grade 8 proficiency rates. We acknowledged that scale scores are a limited but legitimate measure of test-based student performance; certainly no less limited than proficiency rates, but still arguably as valid and reliable.
In our response to NPS, however, we do argue that while scale scores are acceptable for this sort of analysis, averaging scale scores
across grade levels creates a distortion that renders the scale scores less valid as school performance measures.
The problem with averaging scale scores across grades is that each grade level has a different mean scale score and a different distribution of scores around that mean. Table 1, originally presented in our response, shows the different mean scores for each grade level of Newark’s schools, both charter and NPS. The Grade 8 mean score differs from the Grade 4 mean score by over 16 points.
Table 1– Weighted Mean Scale Scores, NJASK LAL, 2013, Newark Only (Charter & NPS)
| Test | Obs | Mean | Std. Dev. | Min | Max |
| LAL 8 | 3301 | 205.0583 | 11.06671 | 183 | 235.8 |
| LAL 7 | 3154 | 193.2245 | 15.9329 | 170.5 | 227.6 |
| LAL 6 | 3631 | 192.7007 | 11.03825 | 172.9 | 224.5 |
| LAL 5 | 3255 | 189.9525 | 12.66214 | 166.1 | 217.0 |
| LAL 4 | 3223 | 188.3744 | 14.46348 | 165.6 | 235.5 |
| LAL 3 | 3680 | 194.5205 | 12.0455 | 173.9 | 235.7 |
Why does this matter? Consider two schools with exactly the same average scale scores in all grades; now imagine that they each scored exactly at the citywide mean in all grades. One school, however, has considerably more 8th graders than 4th graders. That school would have an advantage when compared to the other: its larger proportion of 8th graders would push up its overall average, because the mean score for 8th grade is higher than the mean score for 4th. Weighting the means by the number of students in each grade wouldn’t solve this problem; in fact, it creates the problem, because the “average” student in 8th grade gets a higher score than the “average” student in 4th. More weight is being put on the score that is arbitrarily higher.
This problem is further compounded when running a linear regression. Because the dependent variable, grade-averaged mean ELA scale scores, is distorted by grade enrollment, the independent variables do not have a consistent relationship to the dependent variable from school to school. In effect, the rules change for every player.
A more defensible technique for averaging across grades is to run a linear regression for each grade, then calculate standardized residuals, which allow for comparisons across different mean scores. Those residuals are then averaged, weighted for student enrollment.
Figure 4 uses this methodology. Careful readers will notice that the relative position of many schools has shifted from Figure 1, significantly in some cases. Once again, however, there are “Great” schools that underperform relative to “Falling Behind” schools.
Even under this improved method, the classification of schools under One Newark remains arbitrary and capricious.

[1] Akerlof, G.A. (1970). Quarterly Journal of Economics (84) 3, 488-500. https://www.iei.liu.se/nek/730g83/artiklar/1.328833/AkerlofMarketforLemons.pdf
[2] For a classic example, see: Friedman, M. (1980) “What’s Wrong With Our Schools?” http://www.edchoice.org/the-friedmans/the-friedmans-on-school-choice/what-s-wrong-with-our-schools-.aspx
[3] – An Empirical Critique Of “One Newark”: https://njedpolicy.wordpress.com/2014/01/24/new-report-an-empirical-critique-of-one-newark/
– “One Newark’s” Racially Disparate Impact On Teachers:
https://njedpolicy.wordpress.com/2014/03/09/one-newarks-racially-disparate-impact-on-teachers/
– A Response to “Correcting the Facts about the One Newark Plan: A Strategic Approach To 100 Excellent Schools”: https://njedpolicy.wordpress.com/2014/03/24/a-response-to-correcting-the-facts-about-the-one-newark-plan-a-strategic-approach-to-100-excellent-schools/
[4] The paper application used for One Newark is no longer available at NPS’s website. Originally retrieved from: http://onewark.org/wp-content/uploads/2013/12/One-Newark-Enrolls-Paper-Application.pdf
[5] http://onewark.org/wp-content/uploads/2013/12/StrategicApproach.pdf
[6] See: A Response to “Correcting the Facts about the One Newark Plan: A Strategic Approach To 100 Excellent Schools,” p. 8.
[7] North Star, however, does engage in significant patterns of student cohort attrition that likely affect its student population and test scores. See: http://schoolfinance101.wordpress.com/2013/10/25/friday-story-time-deconstructing-the-cycle-of-reformy-awesomeness/
[8]http://www.wnyc.org/articles/new-jersey-news/2013/mar/18/everything-you-need-know-about-students-baked-their-test-scores-new-jersy-education-officials-say/
[9]https://njedpolicy.wordpress.com/2013/05/02/deconstructing-disinformation-on-student-growth-percentiles-teacher-evaluation-in-new-jersey/
