Research Note: On Student Growth & the Productivity of New Jersey Charter Schools
Bruce D. Baker, Rutgers University, Graduate School of Education
October 31, 2014
PDF: Research Note on Productive Efficiency
In June of 2014, I wrote a brief in which I evaluated New Jersey’s school growth percentile measures to determine whether factors outside the control of local schools or districts are significantly predictive of variation in those growth percentile measures.[1] I found that this was indeed the case. Specifically, I found:
Student Population Characteristics
- % free lunch is significantly, negatively associated with growth percentiles for both subjects and both years. That is, schools with higher shares of low income children have significantly lower growth percentiles;
- When controlling for low income concentrations, schools with higher shares of English language learners have higher growth percentiles on both tests in both years;
- Schools with larger shares of children already at or above proficiency tend to show greater gains on both tests in both years;
School Resources
- Schools with more competitive teacher salaries (at constant degree and experience) have higher growth percentiles on both tests in both years.
- Schools with more full time classroom teachers per pupil have higher growth percentiles on both tests in both years.
Other
- Charter schools have neither higher nor lower growth percentiles than otherwise similar schools in the same county.
On the one hand, these findings raise some serious questions about the usefulness of the state’s growth percentile measures for characterizing school effectiveness. At the very least, if one wishes to compare the growth percentiles of one school to another, one should use a statistical approach that first corrects for those factors that are a) outside of the control of local school officials and b) substantively influence growth.
While I’ve been critical of the growth percentile data produced by the state, most notably for their failure to more completely address these issues, the growth percentile measures are certainly more useful than performance level measures which are even more highly correlated with differences in demographics and other contextual variables.
Here I use the growth percentile measures as the outcomes of interest in a set of models wherein I attempt to estimate the relative efficiency of production of outcomes across New Jersey schools. Given the findings of my previous analyses, if I wish to compare school growth percentiles and make assertions about how well one school versus another achieves growth, I must account for several factors.
I must, for example, account for a) initial performance levels, b) demographic differences, c) school size and grade range differences.
Here, my goal is slightly different from the previous analysis in terms of how I characterize resources. Here, the goal is to correct for the aggregate resource inputs to each school, on the assumption that schools (or their operators) might make tradeoffs between teacher compensation, compensation structures and class sizes to achieve greater efficiency in producing student achievement gains. Lacking comprehensive school site spending data in New Jersey, I take a second best (perhaps third or fourth) approach of using the summed certified staffing salaries per pupil as a proxy for total fiscal resource inputs. Otherwise the regressions are identical to those in the previous analysis.
Table 1 shows the regression model output.
Table 1
Again, we can see that these various factors explain from around 20 to nearly 40% of the variation across schools in growth percentiles.
We also see that aggregate school resources matter. Schools with higher certified staffing spending per pupil are also showing higher growth.
But we can also use these models to compare the relative performance of schools in the models. Specifically, we can evaluate the extent to which a school’s actual growth percentile is higher or lower than would be predicted, given the school’s population, resources and other characteristics. Because there are other unmeasured common pressures on schools in particular locations, including differences in the value of the dollar inputs from Newark to Camden or Atlantic City, I compare schools against others in the same county (rather than city in this case, because so many cities in New Jersey have such small numbers of schools). So, each school is compared against similar spending, similar student, and other similar characteristic schools in their county, but in a statewide model.
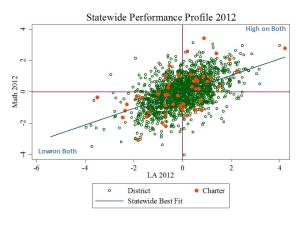
Now let’s take a look at performance distributions of charter and district schools for 2013 and for 2012 on math and language arts growth. We know from my previous research note that the average difference in growth between charter and district schools was “0.” But averages are uninteresting and provide little policy guidance. What’s more interesting is evaluating the variation in charter, and for that matter district school growth, corrected for the various factors above.
Figure 2 shows the statewide 2013 performance profile – the relationship between corrected language arts and corrected math growth percentiles. The two are modestly related (.49). Schools in the upper right are high on both and in the lower left are low on both. Charters, like district schools are scattered throughout the distribution.
Figure 2
Figure 3 looks pretty much like Figure 2 with charter and district schools scattered. In both cases, it is generally true, via modest correlation (.53), that schools that were high on one assessment, tended to be higher on the other. I cannot be entirely confident whether these patterns reflect true quality differences in production of outcomes, or whether they simply represent outside factors not fully controlled for in the models.
Figure 3
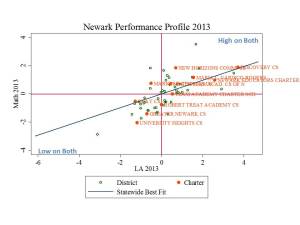
Figure 4 looks specifically at schools in the city of Newark in 2013. Again, charter and district schools are scattered, with some district schools performing quite high on both LA and Math. Higher (on both) performing charters, in terms of resource and need adjusted growth, include Discovery, Maria Varisco Rogers and Newark Educators charter, and low performing charters included University Heights and Greater Newark.
Figure 4
TEAM academy was average on Math and slightly above average on LA. Robert Treat was average on LA and slightly below average on Math. North Star was slightly above average on both.
Patterns are similar for 2012, with Discovery being the standout, and University Heights being in positive rather than negative position. North Star again showed better than average growth on both tests, but TEAM showed slightly below average growth adjusted for resources, students, enrollment size and grade range.
Figure 5
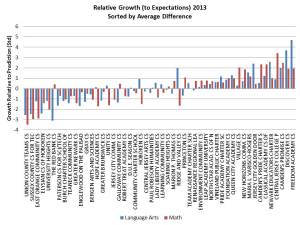
These final two graphs rank charter schools statewide by their performance on growth measures, given their resources, students, enrollment size and grade range. Figure 6 shows the 2013 ranking and Figure 7 shows the 2012 ranking. Both charts are sorted from lowest (average across both tests) to highest growth against expectations.
Figure 6 shows that Freedom Academy, Discovery Charter School and Camden’s promise had the greatest achievement growth given their resources, students, enrollment size and grade range and Union County TEAMS, Sussex County CS for TEC and East Orange CS had the lowest growth against expectations. In 2012, Discovery and Camden’s promise also did very well.
But other more “talked about” charters fall within or closer to the average mix of schools. Specifically, large and long running charter operators in Newark, include TEAM academy, whose performance is consistently around average (slightly above or slightly below). North Star Academy is consistently slightly to modestly above average, while Robert Treat Academy is more consistently below average on the student growth measures adjusted for resources, students, enrollment size and grade range.
Importantly, the distribution of charters around the mean is not different from the distribution of district schools around the statewide mean, as shown in Figures 2 and 3 above, and as estimated in my previous brief.[2]
Figure 6
Figure 7
Conclusions & Implications
Of course, the big question is what to make of all of this, if anything. Much has been debated in recent years about the average test scores and proficiency rates of these schools and of charter schools and district schools in comparison. That debate requires a cautious accounting for a variety of student background characteristics which substantively influence status measures of student performance.
Notably, so too do the state growth percentile measures require substantial adjustment for student characteristics. But these measures should provide some more insights into differences across schools in their achievement, most notably, whether kids under their watch are achieving normatively better or worse achievement growth on math and language arts assessments.
As I’ve opined on numerous occasions, the interesting question is not whether the charter sector on the whole or by location “outperforms” district schools, but rather, what’s going on behind the variation. Using analyses of this type, we should begin exploring in greater depth what’s going on in schools more consistently in the upper right and lower left hand corners of these distributions. Applying these methods and measures, we may find schools we hadn’t previously considered worthy of that closer look.
[1] https://njedpolicy.files.wordpress.com/2014/06/bbaker-sgps_and_otherstuff2.pdf
[2] https://njedpolicy.files.wordpress.com/2014/06/bbaker-sgps_and_otherstuff2.pdf
==================
Raw model output: Productivity Output
Stata code for compiling (and rolling up) resource and demographic measures: Step 1-Staffing Files | Step 2-SRC Aggregation | Step 3-School Resource Aggregation


